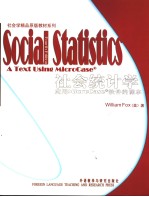

社会统计学:应用MicroCase软件的课本PDF电子书下载
- 电子书积分:12 积分如何计算积分?
- 作 者:(美)福克斯(Fox,W.)著
- 出 版 社:北京:外语教学与研究出版社
- 出版年份:2004
- ISBN:7560045588
- 页数:342 页
Part Ⅰ Introduction and Univariate Analyses 1
Chapter 1 Statistics and Variables 3
1.1 Statistics and Data 4
1.2 Overview of Statistics 5
1.3 Samples and Populations 6
1.4 Variables 8
1.5 Levels of Measurement 9
1.6 Mutually Exclusive and Collectively Exhaustive 14
1.7 Continuous and Discrete Variables 15
1.8 What Cases, Variables, and Data Files Look Like 16
1.9 Aggregate Data 18
1.10 Ideas and Thinking 20
1.11 Playing with Data 22
1.12 Summing Up Chapter 1 22
Chapter 2 Frequency and Percentage Distributions 27
2.1 Frequency Distributions 28
2.2 Percentage Distributions 31
2.3 Cumulative Distributions 34
2.4 Creating Sensible and Well-Formatted Tables 36
2.5 Collapsing Variables 38
2.6 Excluding Missing Data 42
2.7 Selecting Subsets of Cases 45
2.8 Pie Charts and Bar Graphs 45
2.9 Outliers 48
2.10 Mapping Ecological Variables 49
2.11 Summing Up Chapter 2 51
Writing Statistics 1: Percentages Distributions, Graphs, and Maps 55
Chapter 3 Averages 61
3.1 Mode 62
3.2 Median 63
3.3 Mean 66
3.4 Properties of the Mean 68
3.5 The Mean for Dichotomous Variables 70
3.6 Which to Use—Mode, Median, or Mean? 72
3.7 Summing Up Chapter 3 75
Chapter 4 Measures of Variation 79
4.1 Variances and Standard Deviations 80
4.2 Shapes of Distributions 87
4.3 Standard Scores (Z-Scores) 89
4.4 Normal Distributions 91
4.5 Sampling Distributions 94
4.6 Confidence Intervals 98
4.7 Some Cautions Using Univariate Statistics 100
4.8 Summing Up Chapter 4 102
Writing Statistics 2: Averages and Standard Deviations 105
Part Ⅱ Bivariate Analyses 107
Chapter 5 Cross-tabulation 109
5.1 Bivariate Frequency Tables 110
5.2 Bivariate Percentage Tables 113
5.3 How to Read Percentage Tables 116
5.4 Positive, Negative, and Curvilinear Relationships 118
5.5 Format Conventions for Bivariate Tables 122
5.6 Stacked Bar Graphs for Bivariate Relationships 125
5.7 A Caution About Bivariate Tables Based on Small Ns 126
5.8 Association Does Not Imply Causation 127
5.9 Summing Up Chapter 5 129
Chapter 6 The Chi-Square Test of Statistical Significance 133
6.1 The Logic of Tests of Statistical Significance 134
6.2 The Chi-Square Test 137
6.3 Problems with Expected Frequencies Less Than 5 144
6.4 Statistical Significance Does Not Mean Substantive Significance 145
6.5 Significance Tests on Population Data 147
6.6 Summing Up Chapter 6 147
Chapter 7 Measures of Association for Cross-tabulations 151
7.1 Overview of Measures of Association 152
7.2 Chi-Square-Based Measures for Nominal Variables V and φ 152
7.3 Lambda 155
7.4 Choosing a Nominal Measure of Association 158
7.5 Measures of Association for Ordinal Variables: Gamma 159
7.6 Somers' DYX 164
7.7 Measures of Association: An Overview 168
7.8 Summing Up Chapter 7 169
Writing Statistics 3: Bivariate Cross-tabulations 172
Chapter 8 Comparison of Means and t Test 175
8.1 Box-and-Whiskers Diagrams/Differences Between Means 176
8.2 t Test for the Difference Between Means 179
8.3 Assumptions and Cautions Concerning t Test 186
8.4 One-Tailed and Two-Tailed Tests 188
8.5 Confidence Intervals for Differences Between Means 190
8.6 Summing Up Chapter 8 192
Writing Statistics 4: Comparison of Means and t Test 195
Chapter 9 Analysis of Variance 197
9.1 Box-and-Whiskers Diagrams/Differences Among Means 198
9.2 Purpose and Assumptions of Analysis of Variance 201
9.3 The Logic of Analysis of Variance 202
9.4 The ANOVA Table 211
9.5 The Correlation Ratio (E2) 211
9.6 Two-Way Analysis of Variance (and Beyond) 213
9.7 Three Cautions About Statistically Significant F Ratios 214
9.8 Summing Up Chapter 9 215
Writing Statistics 5: Analysis of Variance 218
Chapter 10 Regression and Correlation 221
10.1 Scatterplots 222
10.2 Scatterplots and the Strength of Relationships 225
10.3 Some Limitations of Scatterplots 228
10.4 Regression and Least-Squares Lines 229
10.5 Calculating Regression Coefficients 233
10.6 Correlation Coefficient (r) 234
10.7 r2 as Proportion of Variation Explamed 239
10.8 Correlations Between Dichotomous Variables 241
10.9 Association Still Does Not Imply Causation 242
10.10 Linear and Nonlinear Relationships 242
10.11 Test of Significance for a Correlation Coefficient 243
10.12 Correlation Matrix 245
10.13 Summing Up Chapter 10 247
Writing Statistics 6: Regression and Correlation 251
Part Ⅲ Multivariate Analyses 253
Chapter 11 Multivariate Cross-tabulation 255
11.1 The Logic of Causal Relationships 256
11.2 Spurious Relationships 258
11.3 Some Terminology 261
11.4 Examples of Spurious Relationships 262
11.5 Replication 263
11.6 Somewhere Between Explanation and Replication 264
11.7 Specification 265
11.8 Suppressor Variables 266
11.9 Controlling for an Intervening Variable 269
11.10 Partial Gamma 271
11.11 An Overview of Elaboration 272
11.12 Elaboration and Problems of Small Ns 273
11.13 The Relationship of Multivariate Analysis to Experiment Design 274
11.14 Summing Up Chapter 11 276
Writing Statistics 7: Multivariate Cross-tabulation 279
Chapter 12 Multiple Regression and Correlation 281
12.1 Extending the Regression Model 281
12.2 Multiple Correlation Coefficient 287
12.3 Standardized Regression Coefficients (Beta Coefficients) 289
12.4 Significance Tests for Multiple Correlation Coefficients 291
12.5 Regression with Dichotomous and Dummy Variables 292
12.6 Summing Up Chapter 12 295
Writing Statistics 8: Multiple Regression and Correlation 299
Appendix Statistical Tables 301
Table 1: The Chi-Square Distribution 303
Table 2: The t Distribution 304
Table 3A: The F Distribution: p = .05 305
Table 3B: The F Distribution: p = .01 306
Table 3C: The F Distribution: p = .001 307
Glossary 309
Bibliography 325
Index 329
- 《建筑施工企业统计》杨淑芝主编 2008
- 《钒产业技术及应用》高峰,彭清静,华骏主编 2019
- 《红色旅游的社会效应研究》吴春焕著 2019
- 《现代水泥技术发展与应用论文集》天津水泥工业设计研究院有限公司编 2019
- 《社会学与人类生活 社会问题解析 第11版》(美)James M. Henslin(詹姆斯·M. 汉斯林) 2019
- 《英汉翻译理论的多维阐释及应用剖析》常瑞娟著 2019
- 《数据库技术与应用 Access 2010 微课版 第2版》刘卫国主编 2020
- 《区块链DAPP开发入门、代码实现、场景应用》李万胜著 2019
- 《虚拟流域环境理论技术研究与应用》冶运涛蒋云钟梁犁丽曹引等编著 2019
- 《凯恩斯文集 第13卷 社会、政治和文学论集》严忠志译 2018
